2021 ESG Highlights
Environmental
Enhanced target setting across operations, including a Net Zero 2030 emissions target for our terminals.
Development of our climate risk framework
Publication of our environmental policy
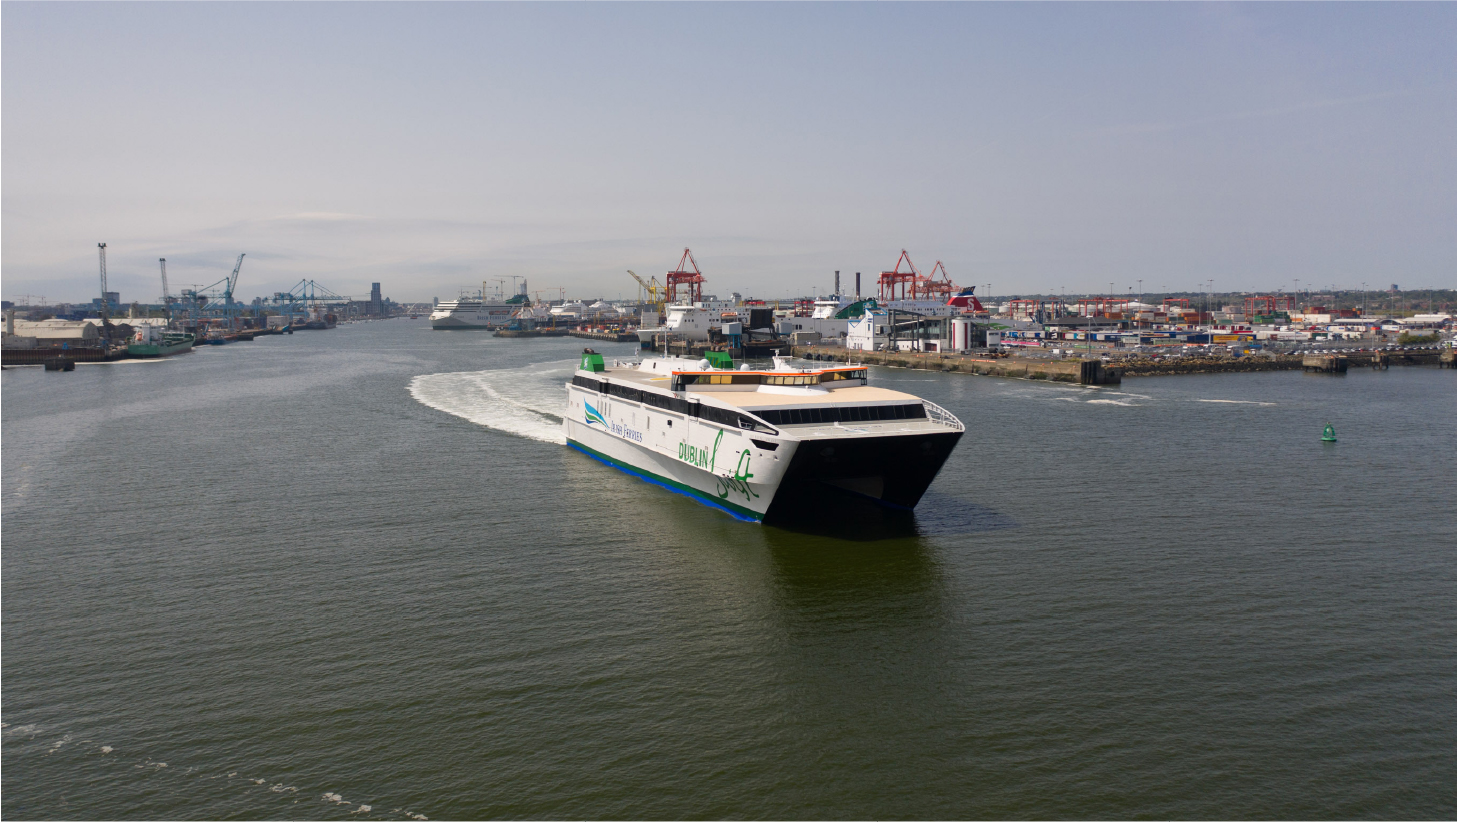
Trial of sustainable biofuel blend on board Dublin Swift
Trial of robotic underwater hull cleaning for Elbtrader
Enhanced data monitoring of greenhouse gases across fleet
Early energy efficiency design index certification for Ulysses and Isle of Inishmore
Improved machinery efficiency on board Ulysses
Overhaul of electrical network at DFT
Use of 100 percent green electricity at BCT, DFT and head office
Replacement of petrol/diesel company cars with new electric and hybrid models
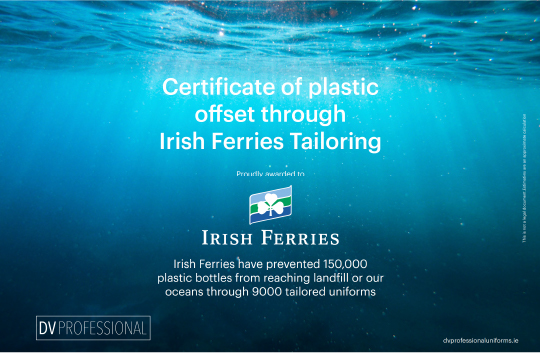
9,000 new crew garments made from recycled plastics equating to 150,000 plastic bottles
Bamboo flooring fitted in 1,100 new and refurbished containers
Installation of solar panels on our DFT engineering building
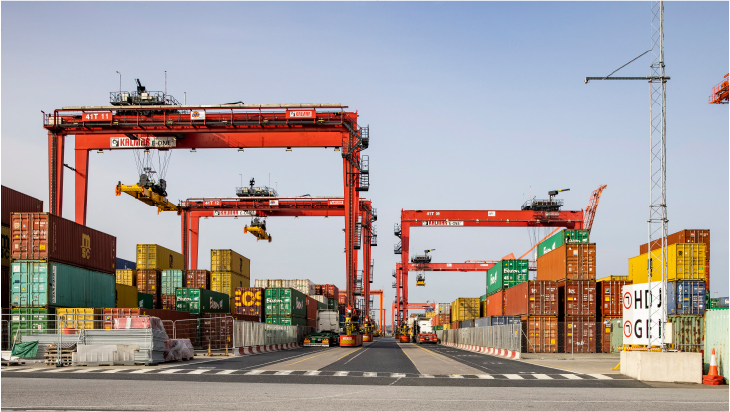
Investment in five additional electric cranes at DFT to replace existing diesel units in 2022
Continued rollout of ballast water treatment project across fleet
Installation of a wash water recycling system at our Dublin Inland Port facility, providing up to 90 percent savings in wash water consumption
Upgrade of waste management contracts at office locations to improve contributions to the circular economy
Social and Governance
63 percent reduction in overall Lost Time Injury Frequency rate versus 2020
Facilitation of hybrid working arrangements for office-based staff during Covid-19
Development of our Supplier Code of Conduct
Enhancement of our human rights policies and third-party communications on human rights issues
Strengthening of partnerships with our sponsored charities
Participation in campaigns to re-start the wider tourism industry following the Covid-19 travel restrictions
Promotion of fresh, local produce on board our ferries
Introduction
Over the past 12 months, we have placed a significant focus on enhancing our approach to Environmental, Social and Governance (ESG) and sustainability. The following pages are designed to provide insight into our approach to – and management of – environmental, social, and governance issues across our value chain. As a business, we recognise the growing importance of providing transparency over our efforts to create value in a sustainable manner, based on a set of topics which we have identified as material to our business and our stakeholders.
In developing this report, our approach was informed by a review of best practice sustainability reporting standards and frameworks. Guidelines and recommendations by the Global Reporting Initiative (GRI), the Sustainability Accounting Standards Boards (SASB) and the integrated reporting framework have all been considered for the creation of this report. In addition, the UN Sustainable Development Goals (SDGs) played a key role in the development of our overarching strategy for ESG and sustainability. In this report, we map the Group activities we feel best support the SDGs. We have also reported indicators under the Marine Transportation SASB standards, as well as taking our first steps to greater integration of the requirements of the Task Force on Climate-related Financial Disclosures (TCFD).
As we continue to enhance our disclosures, we remain focused on improving our processes and procedures for tracking, monitoring, and measuring our performance in relation to the sustainability factors that are relevant and important for our company and our industry. The focus on ensuring the accuracy of our ESG data will be central to our ability to drive performance in the period ahead. While we recognise that we still have a way to go, we consider the steps we have taken over the past number of years as creating the foundation from which we can further develop our approach to sustainability, ESG and strong reporting in the years ahead.
During the year, we enhanced our ESG policies. We have updated and implemented several policies to ensure they address core risks and opportunities within our business. These new and enhanced policies were also designed to reflect the changing landscape in which we operate.
In 2020, we outlined our ESG maturity level using the table below and the stages involved in the voyage ahead. While we still have a way to go, we are pleased with our progress made against this timeline in 2021, with further targets set across our vessel and terminal operations, the advancement of the decarbonisation project at our terminals and enhanced reporting of metrics in line with SASB and TCFD frameworks. We continue to look beyond our own operations and influence sustainability considerations of our supply chain partners through processes documented in our Supplier Code of Conduct.
Timeline | |
Up to 2021 |
|
2022-2025 |
|
After 2025 |
|
The Role of Materiality
The valuable insight provided by external reporting frameworks as well as the knowledge and experience of our leadership team has helped shape our response to sustainability issues. However, in continuation of the process to develop our approach to sustainability and ESG, we intend to carry out an in-depth materiality assessment during 2022. This is an important step in our adopted climate change risk framework outlined on pages 64 to 66. Although there is a consistent focus on the disclosure of ESG and sustainability information, it can often be difficult to identify and assess which information is most useful. Through research and extensive engagement with our key stakeholders, we will determine the sustainability issues that are most likely to impact our ability to create value over the short, medium, and long term. The output of the assessment will also inform the development of our long-term strategy with the ongoing integration of sustainability factors into our strategy and interaction with stakeholders.
Aligning operations with our contribution
‘Our purpose is to achieve continued success in our chosen markets, delivering a safe, reliable, timely, good value and high-quality experience to our customers in a way that minimises our impact on the environment.’
At ICG, stakeholder and environmental focus have been key elements within our longstanding mission statement. Within our operating regions, ICG activities positively impact society as a key transport provider of goods and essential supplies and as a significant contributor, under the Irish Ferries brand, to the tourism industries of Ireland, the UK and France, which includes co-operative campaigning to support tourism in areas least visited or most impacted by seasonal factors. In more recent years, we have sought to align our purpose and activities with wider reporting frameworks as a means of maximising our positive impact on society. In addition to the five goals of the UN SDGs that we felt we could most effectively contribute to in last year’s annual report, we are also supporting SDG 9 through our strategic focus on upgrade infrastructure and retrofit projects with increased resource-use efficiency and greater adoption of clean and environmentally sound technologies and processes.
In 2021, we undertook an assessment to determine where we are making the biggest contribution to the SDGs. This involved mapping the 17 goals and 169 targets against information provided by our business units when compiling this sustainability report, as well as the formal policies set out within those business units and at a corporate level. The outcome of this process was used to rate our overall alignment and contribution to each goal. As highlighted within the pages of this report, the activities we believe best support the Group’s core SDGs are:

Employee engagement practices
Striving for greater diversity and inclusion, including through policies and initiatives
Being a leader in health and safety, utilising a data driven approach
Flexible working policies as well as a range of employment benefits
Upgrade of infrastructure and retrofit projects with increased resource-use efficiency
Adoption of clean and environmentally sound technologies and processes
Implementing effective waste management systems throughout our vessels
Development of our formal environmental policy
Setting targets for the reduction of our emissions
Expanding reporting and engagement with external stakeholders
Enhancing pollution prevention systems
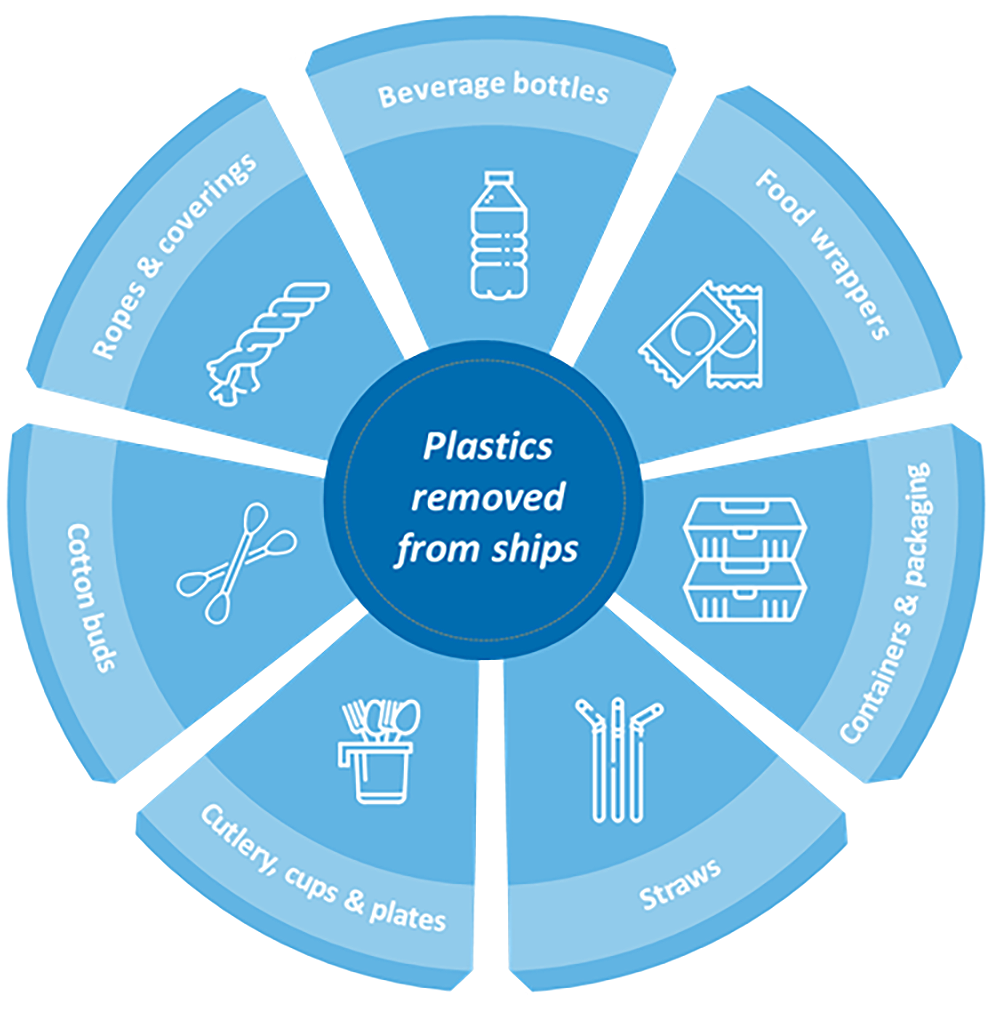
Novel and market leading circular economy programmes preventing plastics from reaching the oceans
The Voyage Ahead
It is reported that the maritime industry is responsible for 2.5 percent of global greenhouse gas (GHG) emissions (UN Climate Change News, 2018). As an organisation we recognise our responsibility to reduce our emissions in line with stakeholder interests and relevant targets set for the industry. ICG is a heavily regulated business, and one that has been conscious of its environmental footprint for a long time. To demonstrate our commitment to environmental sustainability, this year we formalised our Environmental Policy, which can be found on our website.
Decarbonising our Vessel Operations
The International Maritime Organization (IMO), a specialised agency of the United Nations responsible for regulating shipping, and the European Union (EU) have each set decarbonisation goals for the maritime industry. Current IMO targets aim to reduce the industry’s total CO2 emissions per transport work by 40 percent by the year 2030 and overall GHG emissions by at least 50 percent by 2050 compared to 2008 levels. The EU has targeted an industry reduction in GHG intensity of 6 percent by 2030, accelerating in five-year stages to 75 percent by 2050, compared to 2020 levels. While regulatory developments at the IMO and EU are ongoing, we are aligning our decarbonisation strategy with the IMO and EU goals and will adjust accordingly to achieve, at a minimum, all required targets. As the maritime industry has unique challenges arising from the current lack of proven, accessible alternative fuels, particularly for large vessels, our current decarbonisation strategy for our vessels is focused on achieving the above targets through a range of short-term operational measures and longer-term technical measures.
Operational Measures
- Operation of green voyage programme to optimise voyage factors such as; port operations, navigational routing and speed management.
- Environmental performance monitoring and advanced data analytics using fleet management software S-Insight.
- Proactive monitoring of real-time vessel performance through a live feed from the vessels’ engine power management system, facilitating vessel responsiveness during different operation modes, including Eco-mode. In late 2021, installation commenced onboard the W.B. Yeats which, if successful, shall be expanded across the fleet.
- Regular drydocking of vessels to reduce hull fouling and ensure high maintenance of machinery. We are currently trialling an underwater robotic hull cleaning program for our Elbtrader vessel and are assessing improvements in speed management and fuel efficiency.
- Use of experienced crews and port operations teams to increase efficiency.
- Continuous improvement of vessel performance in line with relevant Ship Energy Efficiency Management Plans (SEEMPs).
- Ongoing research and trialling of accessible alternative fuels, including sustainable biofuels reduce emissions. The Dublin Swift underwent a trial in 2021 using a small biofuel blend derived from used cooking oils.
Technical Measures
- Long-term replacement of existing fleet with efficient ships incorporating latest technologies, in line with vessel life cycles. Our W.B. Yeats vessel is approximately 35 percent more efficient than its predecessor Oscar Wilde.
- Increased utilisation of onshore power within the EU enabled by FuelEU Maritime proposals.
- Compliance with ongoing design efficiency requirements under IMO energy efficiency design index for new (EEDI) and existing (EEXI) ships. In 2021, we obtained early class certification that Ulysses and Isle of Inishmore exceed the required EEXI applicable to existing ships from 2023 and will seek certification for the remaining fleet in 2022.
- Investment in exhaust gas cleaning systems on board certain vessels that minimise sulphur emissions to below levels mandated by existing regulation.
- Investment in upgraded, more efficient turbochargers on board Ulysses in late 2021. This has resulted in a significant lowering of exhaust temperatures, reducing overall wear and tear and improving fuel efficiency.
- Use of innovative, non-toxic, anti-fouling hull paints to reduce resistance when moving through water.
- Use of energy efficient propeller blades to decrease resistance and improve fuel efficiency.
We continually research and assess the feasibility of retrofit projects to improve the emissions performance of our fleet, ensuring innovative technologies that are safe and proven effective can be introduced where appropriate. This includes;
- Ongoing investment and assessment of suitable technologies to improve existing fleet including; air lubrication systems and wind assisted propulsion systems.
- Collaboration with suitable marine technology companies participating in clean energy projects and innovations.
- Ongoing assessment of adjustments to vessel structure to improve efficiency, such as assessing modifications to a vessel’s hull shape.
A core element of our decarbonisation strategy is to gather consistent data that aligns with regulatory requirements. This includes ongoing emissions data verification under both the EU Monitoring, Reporting and Verification (MRV) Regulation for which Group vessels have complied with since 2018, and the IMO Fuel Oil Data Collection System (DCS) reporting which came into effect in 2019.
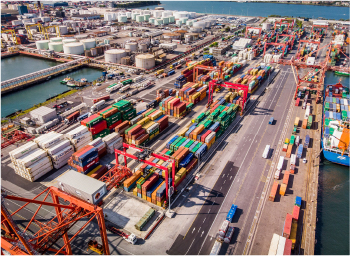
Decarbonising our Terminal Operations
Whilst we are aligning with, and driving innovation to go beyond, regulatory requirements for our fleet, for our Terminal operations we have made more immediate progress in target setting. Alongside the publication of this report, we are setting a target to achieve a 70 percent emissions reduction in our Dublin (DFT) and Belfast (BCT) terminal operations by 2025, versus 2020 levels. We are also targeting net zero DFT and BCT terminal operations by 2030.
The decarbonisation project at our terminals began in 2017 when our first two electric powered Rubber-Tyred-Gantry (RTG) cranes were introduced to DFT, in addition to our diesel units. Our electric RTG capacity doubled in 2019 with the addition of two more units, replacing three diesel cranes, while Belfast Harbour Commissioners upgraded its entire yard crane fleet with eight electrical RTG units from 2019 to 2021. In 2022, DFT will commission five additional electric RTGs; two additions to the fleet and three replacements for end of life diesel cranes. This will increase the overall DFT fleet to 75 percent electrically powered. In making this transition, significant investment is also underway to improve the terminal’s electrical network, including the replacement of all medium voltage switchgear, distribution cabling and transformers, preparing the terminal for the requirements of the next 40 years. In late 2021, solar panels were installed on our DFT engineering building, which will generate energy to heat our building and power electric vehicle charging points available to staff and company electric cars and vans. Company cars are being replaced with electric and hybrid models in line with replacement cycles. Four new electric and hybrid cars were ordered in 2021 to replace old petrol and diesel cars used by sales and operations staff. LED lighting is installed within our terminal buildings and flood and mast lighting systems around the terminals. Since mid-2020, the electricity supply for our DFT terminal and Dublin offices is certified green, while our Belfast Terminal has been powered by 100 percent green electricity for the last several years.
Environmental Data
Shipping Operations
Topic | Relevant Metric | 2021 | 2020 | 2019 | Unit of measure | SASB Reference |
Greenhouse gas emissions | Gross global Scope 1 shipping emissions | 399,796 | 336,535 | 381,261 | Metric tons (t) CO2-e | TR-MT-110a.1 |
CO2 emissions per GT mile | Grams (g) CO2 / gross ton-nautical mile | |||||
| 16.58 | 15.34 | 15.72 | N/A | ||
CO2 emissions per transport work | Grams (g) CO2 / cargo ton-nautical mile | |||||
| 40.08 | 43.96 | 44.98 | N/A | ||
Total energy consumed | 5,111,364 | 4,305,170 | 4,876,440 | Gigajoules (GJ) | TR-MT-110a.3 | |
Percentage heavy fuel oil | 75.97% | 74.91% | 75.28% | Percentage (%) | TR-MT-110a.3 | |
Average Energy Efficiency Design Index (EEDI) for new ships | 18.5 | 18.5 | 18.5 | Grams (g) of CO2 per ton-nautical mile | TR-MT-110a.4 | |
Air quality | NOx (excluding N20) | 7,882 | 7,393 | 8,377 | Metric tons (t) | TR-MT-120a.1 |
SOx | 623 | 525 | 2,767 | Metric tons (t) | TR-MT-120a.1 | |
Particulate Matter (PM10) | 396 | 341 | 562 | Metric tons (t) | TR-MT-120a.1 | |
Ecological Impacts | Shipping duration in marine protected areas or areas of protected conservation status | Nil | Nil | Nil | Number of travel days | TR-MT-160a.1 |
Percentage of fleet implementing ballast water exchange | 94.12% | 92.31% | 92.31% | Percentage (%) | TR-MT-160a.2 | |
Percentage of fleet implementing ballast water treatment | 29.41% | 15.38% | 7.69% | Percentage (%) | TR-MT-160a.2 | |
Number of spills and releases to the environment | 1 | 2 | 1 | Number | TR-MT-160a.3 | |
Aggregate volume of spills and releases to the environment | 0.01 | 0.201 | 0.02 | Cubic meters (m3) | TR-MT-160a.3 | |
Workforce health and safety | Lost time incident rate from seafaring operations | 1.0 | 4.7 | 4.6 | Rate | TR-MT-320a.1 |
Business ethics | Number of calls at ports in countries that have the 20 lowest rankings in Transparency International’s Corruption Perception Index | Nil | Nil | Nil | Number | TR-MT-510a.1 |
Total amount of monetary losses as a result of legal proceedings associated with bribery or corruption | €Nil | €Nil | €Nil | Euro | TR-MT-510a.2 | |
Accident and safety management | Number of marine casualties | 1 | 1 | 2 | Number | TR-MT-540a.1 |
Percentage classified as very serious | 0% | 100% | 100% | Percentage (%) | TR-MT-540a.1 | |
Number of port state detentions | Nil | Nil | Nil | Number | TR-MT-540a.3 | |
Activity | Number of shipboard workers | 501 | 412 | 455 | Number | TR-MT-000.A |
Total distance travelled by vessels | 824,132 | 642,945 | 703,602 | Nautical miles (nm) | TR-MT-000.B | |
Operating days | 3,744 | 3,408 | 3,454 | Days | TR-MT.000.C | |
Deadweight tonnage | 100,485 | 95,819 | 84,662 | Deadweight tons | TR-MT-000.D | |
Number of vessels in total shipping fleet | 16 | 13 | 13 | Number | TR-MT-000.E | |
- Owned | 12 | 10 | 10 | Number | ||
- Chartered in | 4 | 3 | 3 | Number | ||
-Chartered out | 3 | 2 | 2 | Number | ||
Number of vessel port calls | 6,423 | 5,221 | 5,534 | Number | TR-MT-000.F | |
Twenty-foot equivalent (TEU) capacity (Container fleet) | 5,502 | 5,449 | 4,475 | TEU | TR.MT.000.G | |
Terminal Operations
Relevant Metric | 2021 | 2020 | Unit of measure |
Scope 1 emissions from Terminal operations | 3,117 | 3,349 | Metric tons (t) CO2-e |
Scope 2 emissions from Terminal operations | Nil | 386 | Metric tons (t) CO2-e |
Total Scope 1 and 2 emissions from Terminal operations | 3,117 | 3,735 | Metric tons (t) CO2-e |
Total energy consumed | 74,373 | 71,732 | Gigajoules (GJ) |
Percentage renewable | 43.21% | 26.77% | Percentage (%) |
Overall Group
Relevant Metric | 2021 | 2020 | Unit of measure |
Gross Global Scope 1 emissions | 402,913 | 339,884 | Metric tons (t) CO2-e |
Gross Global Scope 2 emissions | 82 | 468 | Metric tons (t) CO2-e |
Total Scope 1 and 2 emissions | 402,995 | 340,270 | Metric tons (t) CO2-e |
Total fuel consumed | 126,519 | 106,688 | Metric tons (t) |
Total energy consumed | 5,187,201 | 4,738,369 | Gigajoules (GJ) |
Key Terms, Definitions and Commentary
Terms | Definitions | Commentary |
Scope 1 emissions | Direct GHG emissions from sources that are controlled by the Group. | The Group determines its Scope 1 emissions boundary in line with the Greenhouse Gas Protocol (GHG Protocol) using the principle of operational control. In establishing assets under operational control, consideration is given to the length of any charter arrangements, the responsibility for the purchase and consumption of the fuel and the responsibility for the operational activity of the asset being used. CO2 emissions from shipping are calculated using emission factors referenced in IMO Resolution MEPC 245 (66) 2014 “Guidelines on the method of calculation and the attained Energy Efficiency Index (EEDI) for new ships”. Scope 1 emissions from land-based activities are calculated in line with GHG Protocol calculation tools. |
Scope 2 emissions | GHG emissions from the generation of purchased electricity consumed by the Group. | Scope 2 emissions are calculated in line with the GHG Protocol. Where possible, the Group applies supplier specific emission factors to its electricity consumed. Where this information is not available, regional grid emission factors are obtained and applied for the relevant electricity source used by the provider. |
CO2-e | Carbon dioxide equivalent units. | Co2-e includes direct CO2 emissions plus emissions of other gases converted to CO2 based on their equivalent global warming potential. |
CO2 emissions per GT mile | Grams of CO2 per gross ton-nautical mile | The Group considers this metric useful to viewing the carbon intensity of its ferries fleet. Our ferries are significantly heavier than our container fleet and 2021 and 2020 assessments based on transport work are not indicative of fleet efficiency or future performance due to the impacts of Covid-19 on ferry carryings and voyage management. An average intensity for the overall ferries fleet is disclosed. The increase in 2021 from 2020 reflects additions made to our operating fleet and the entry on a new route of shorter distance, impacting overall efficiency. We are continuing to assess baseline performance across all vessels and routes which should be assisted by a return to pre-pandemic operating conditions. |
CO2 emissions per transport work | Grams of CO2 per cargo ton-nautical mile | This is a widely adopted industry metric for container vessels to assess environmental performance. An average intensity for the overall operated container fleet is disclosed. Carbon intensity for the operated fleet improved by approximately 9 percent versus 2020 and 10 percent compared to 2019. |
NOx | Nitrogen Oxides | NOx emissions from shipping are calculated using guidance from the NOx Technical Code and MARPOL Annex VI Regulation 13, Nitrogen Oxides (NOx). Emissions from land-based activities are calculated in line with GHG Protocol calculation tools. |
SOx | Sulphur Oxides | SOx emissions are calculated by fuel-based emission factors. For vessels with exhaust gas cleaning systems (EGCS), a reported SO2/CO2 emission ratio is used to determine the level to which the sulphur content has been scrubbed down. Group SOx emissions have significantly reduced since the installation of exhaust gas cleaning systems and enhancement of sulphur emission regulations in 2020. |
PM10 | Particulate matter | The mass of PM10 is calculated by means of an energy-based emission factor depending on engine type, engine tier and type of fuel consumed. Default emission factors proposed by the Fourth IMO GHG Study - July 2020 were applied. |
Lost Time Incident Rate | Lost time incidents per 1 million hours worked | A lost time incident is an incident that results in absence from work beyond the date or shift when it occurred. |
Marine Casualties | An event, or sequence of events, that occurs directly in connection with the operations of a ship and results in death, serious injury or loss of a person from a ship or material damage to a ship, collision of a ship or material damage to marine infrastructure external to a ship or to the environment. | The reported marine casualty in 2021 relates to contact of Blue Star 1 with a quay during a winter storm. The incident was not considered serious. |
Shipboard workers | Those who work on aboard operated vessels (including direct employees and contractors) | The Group discloses an average number of shipboard workers per vessel across operating vessels per year. Shipboard workers increased by approximately 22 percent in 2021 due to increases to the operating fleet and return to service of the Dublin Swift. |
Operating days | The number of available days in a reporting period minus the aggregate number of days vessels are off-hire due to unforeseen circumstances | Operating days increased in 2021 due to the strategic expansion of our ferries routing and return to service of the Dublin Swift following the easing of Covid-19 restrictions on non-essential passenger travel. |
Water and Resource Use: Life Below Water / Responsible Consumption
While globally there is a heightened emphasis on emissions reduction, we are acutely aware that environmental impact is much wider than just emissions, and we continue to focus on minimising waste and resource use, preventing pollution and protecting biodiversity. Due to the nature of our operations, the protection of marine life is of utmost importance. While every effort is made to prevent spills and releases overboard, accidental releases can occur due to leaks, storms or human error. ICG has zero-tolerance for dumping waste at sea and uses high-quality port reception facilities and ISO certified waste management partners to responsibly discharge and treat various types of waste from our vessels and land-based activities. All vessels use oil recovery systems to recover spent oils which are then sent for recycling. We undertake periodic inspection of our partners’ waste management facilities to gain comfort over their waste treatment and reporting processes. We also use specialised silicon-based non-toxic paints which avoid the release of harmful agents to the sea.
All our vessels carry an Inventory of Hazardous Materials (IHM) certificate on board to demonstrate the control of hazardous materials on ships in compliance with both the EU Ship Recycling Regulation (SRR) and the Hong Kong Convention (HKC) for the Safe and Environmentally Sound Recycling of Ships. All vessels underwent thorough survey and inspection during the year to ensure IHM certification was in place as required.
During the year, we reviewed and upgraded several waste management contracts at our Group locations. At our Dublin offices, we improved our recovery processes for general waste. Our waste management partner employs a combination of Solid Recovered Fuel (SRF) processing and Refuse Derived Fuel (RDF) processing to recover and recycle metals and transfer processed waste for alternative fuel and electricity production, thereby contributing to the circular economy and avoiding landfill. Food and garbage waste generated on vessels at sea is incinerated ashore for biosecurity purposes. We joined UK Chamber of Shipping pledge in 2019 to continuously minimise the generation of shipborne garbage and to the collective goal of zero pollution from ships to sea from plastics. To this effect, we removed all single use plastics from our ships.
During 2020 and 2021, there was some temporary reintroduction of single-use materials as preventative measures for Covid-19, such as takeaway meals for essential freight drivers. These items have since been fully removed from our ferries.
Each crew and office department have designated waste management champions. Their responsibilities are to ensure vessels and office areas are compliant with agreed procedures, to perform checks at waste segregation areas and to improve awareness of consumption methods within their respective areas.
The use of ballast water is important for the safety and stability of our vessels. Ballast water management involves the intake and discharge of ballast water at different locations due to changes to cargo and voyage conditions. However, this process can cause transference of marine life which increases the unintended risk of bringing invasive species to local ecosystems. In line with the Ballast Water Management Convention, shipowners are obligated to install Ballast Water Treatment systems (BWT) on all vessels by 2024 to eliminate transference risk. We have invested and committed significantly to BWT installation projects across our fleet. The W.B. Yeats was delivered with BWT while the Thetis D, Ulysses, Epsilon and Isle of Inishmore projects were completed in 2021, with the remaining fleet scheduled for BWT installation across 2022 and 2023. The Dublin Swift does not use ballast water and is therefore not applicable under the convention.
We onboard water for potable use from certified sources and retain these supplies on-board in certified sanitary conditions. Water stocks are regularly tested in line with on-board policies to ensure it remains of a high quality. Recognising that potable water is a scarce resource we have integrated water conservation measures including devices such as flow controllers. Where permitted, we use seawater for non-potable use, which is treated prior to discharge back to sea.
During the year, an innovative container wash water recycling system was installed at our new Dublin Inland Port facility, providing up to 90 percent savings in freshwater consumption. The system uses biological and separation technology to return used and dirty wash water back to clean and suitable re-use water. If the system is proven successful, we intend to install further recycling systems at our terminals.
Group Consumption Data
Relevant Metric | 2021 | 2020 | Unit of measure |
Total municipal solid waste | 7,736 | 6,130 | Cubic metres (cm) |
Total waste oil and sludge | 4,144 | 2,498 | Cubic metres (cm) |
Total freshwater consumption | 64,680 | 61,686 | Cubic metres (cm) |
Increases in waste and consumption volumes in 2021 reflect the expansions made to our routes and operating fleet, as well as the resumption of non-essential passenger travel towards the end of the busier tourism season. We are working with our ship managers and waste management partners across all office locations and ports served to develop a consistent classification of waste streams to enable enhanced reporting and performance management going forward.
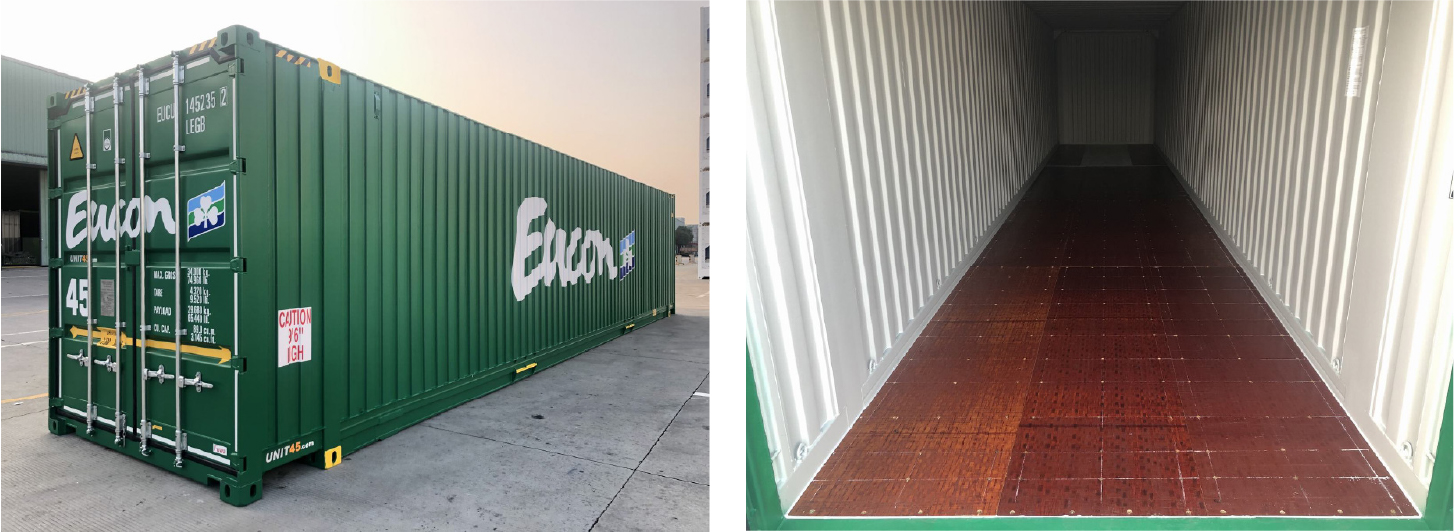
Bamboo flooring is present on new and refurbished Eucon containers. At 31 December 2021, 1,100, or approximately 25 percent of the Group’s container fleet include bamboo flooring. Bamboo self-regenerates from its roots and is considered more sustainable than hardwood trees for its ability to regenerate quickly.
We are promoting responsible consumption through our selection of crew uniforms, which now contain 95 percent recycled polyester recovered from plastic bottles. In 2021 ICG purchased 9,000 garments, equating to 150,000 plastic bottles being recycled and prevented from reaching the oceans or landfill sites. We continually incorporate sustainability considerations into our procurement process. We minimise the number of deliveries to our vessels through containerised provisioning. Our supply chain partner also offers procurement of any new items requested on board The ICG Supplier Code of Conduct sets out our expectations to suppliers regarding the environment, ethics, human rights and health and safety. Full details of this code can be found on our website.
Social: Employee Health and Safety and Diversity and Inclusion
Safety Data
| 2021 | 2020 | 2019 | |||||||||
| Incidents | Exposure hours | Lost Time Injury Frequency | Fatalities | Incidents | Exposure hours | Lost Time Injury Frequency | Fatalities | Incidents | Exposure hours | Lost Time Injury Frequency | Fatalities |
ICG employees and visitors | 1 | 595,200 | 1.7 | 0 | 0 | 595,200 | - | 0 | 1 | 595,200 | 1.7 | 0 |
Key contractors | 7 | 3,627,720 | 1.9 | 0 | 14 | 2,090,676 | 6.7 | 1 | 17 | 2,978,781 | 5.7 | 2 |
8 | 4,222,920 | 1.9 | 0 | 14 | 2,685,876 | 5.2 | 1 | 18 | 3,573,981 | 5.0 | 2 | |
| 2021 | 2020 | 2019 |
| ||||||||
LTIF on land | 4.6 | 6.3 | 6.3 | |||||||||
LTIF at sea | 1.0 | 4.7 | 4.6 | |||||||||
Lost Time Injury Frequency (LTIF) measures the number of recordable workplace incidents resulting in lost days over a year per million hours worked. We are encouraged by our safety performance during the year which saw a 43 percent decrease in the overall number of incidents reported and a 63 percent decrease in LTIF, despite a 57 percent increase in the Group’s total exposure hours. These results are within our previously set targets for 2023 of LTIF on land <5 and LTIF at sea <3.5. The Group has focused on creating a strong safety culture and its performance for the year is a testament to our staff, crews and key third-party contractors who uphold high standards of safety in delivering a quality service for our customers. Regrettably, there were fatalities reported in 2020 and 2019 at our vessels and container terminal. We co-operate fully with all relevant authorities regarding serious incidents. We also investigate all such incidents internally and ensure all necessary steps are taken to improve and to prevent reoccurrences.
Employee Data
31 Dec 2021 | 31 Dec 2020 | |
Total number of employees | 284 | 288 |
| 173 | 175 |
| 111 | 113 |
| 39% | 39% |
| 260 | 260 |
| 24 | 28 |
| 83% | 86% |
Board members | 6 | 6 |
| 5 | 5 |
| 1 | 1 |
| 17% | 17% |
Management staff | 52 | 54 |
| 41 | 42 |
| 11 | 12 |
| 21% | 22% |
Total number of new employee hires | 42 | 16 |
Total number of departures | 47 | 34 |
Turnover rate | 16% | 11% |
| 19% | 13% |
| 13% | 10% |
While our gender ratio is imbalanced in comparison to wider society, it is characteristic of the maritime industry, which has been historically androcentric. According to the International Chamber of Shipping’s Seafarer Workforce Report 2021, the proportion of female seafarers is estimated to be 1.28 percent of the global seafarer workforce. We are committed to improving the representation of women at ICG through developments to our policies and recruitment process.
To demonstrate our strong commitment to equality, diversity, and inclusion, we developed our first Equality, Diversity and Inclusion Policy, which is available on our website. We are committed to creating a positive working environment whereby all employees are respected, valued and can reach their full potential. We believe that a diverse workforce brings a range of skills and experience which will help to make us more creative and competitive. As well as treating people with dignity and respect, ICG strives to create a supportive environment in which all employees can flourish and reach their full potential.
In order to attract, recruit, develop and retain the very best people, we have created an approach based on three key principles:
- Equality - we promote equality of opportunity by seeking to remove barriers, eliminating discrimination, and ensuring equal opportunities and access for all.
- Diversity - we accept each person as an individual. Our success is built on our ability to embrace diversity – and we believe that everyone should feel valued for their contributions. By working together, we will deliver the best possible service for our staff and stakeholders.
- Inclusion - we create a working culture where differences are not merely accepted but valued; where everyone can develop in a way that is consistent with, and adheres to, ICG’s values of impartiality, honesty, integrity, and objectivity.
Our aim is to be an organisation where people feel involved, respected, and connected to our success. At ICG, we strive to be a fully inclusive employer. This includes supporting our workforce by providing the flexibility for a positive work life balance, while continuing to ensure our needs as a business are met. To this effect, we facilitated hybrid working arrangements for our staff in response to changes in the work environment brought upon by the Covid-19 pandemic. We hope that this has helped employees with dependents to manage their responsibilities within and outside of work.
Whistleblowing
ICG is committed to having the highest standards of integrity and transparency. As part of this commitment, we have had policies in place to protect employees when whistleblowing since 2017. This year we enhanced our policy and created a new Protected Disclosure Policy to encourage employees or any person who works or has worked for ICG to make a disclosure in respect of significant matters, and to provide protection for the person making the disclosure.
We seek to always conduct our business honestly and with integrity. It is our policy as an employer to ensure that at every level of management our business complies with all legal requirements that govern our activities. However, we acknowledge that all businesses face the risk of their activities going wrong from time to time, or of unknowingly harbouring malpractice. We believe we have a duty to take appropriate measures to identify such situations and to attempt to remedy them. By encouraging a culture of openness and accountability, we believe we can help prevent such situations occurring. The full details of our Protected Disclosure policy can be found on our website.
Anti-bribery
ICG values its reputation and is committed to maintaining the highest level of ethical standards in the conduct of its business affairs. The actions and conduct of our staff as well as others acting on our behalf are key to maintaining these standards.
We take a zero-tolerance approach to bribery and corruption and are committed to acting professionally, fairly and with integrity in all our business dealings and relationships wherever we operate and implement and enforce effective systems to counter bribery. As such we have developed an Anti-Bribery Policy which applies to all employees, partners/directors, agents, consultants, and contractors. The policy can be read in full on our website.
Human Rights
We are committed to the highest standards of business and ethical behaviour and to the respect of internationally recognised human rights as established in the Universal Declaration on Human Rights and the International Labour Organisation’s Core Conventions. Our Human Rights Policy, which applies to all ICG employees, contractors, agents and business partners, can be accessed through our website. We have a zero-tolerance policy to modern slavery and human trafficking. We take an open and transparent approach, taking steps to identify and tackle any instances of modern slavery in our supply chain which we outline in our Supplier Code of Conduct. ICG and its ship management service providers undertake regular training, including training provided by the United Nations Migration Agency in relation to human trafficking and labour exploitation. Appropriate training and guidance is provided to all commercial and procurement staff. Further details of our Modern Slavery and Human Trafficking Policy can be found on our website.
Corporate Social Responsibility
While the seismic shift in stakeholder expectations of business over the past two years has brought a more material focus to sustainable business practices and ESG, ICG remains committed to contributing to causes that can make a difference. ICG is proud to be a member of the local communities in which we operate. Over the past year, we have continued to support our charitable partners through our CSR programme.
ICG are longstanding supporters of the Dublin Wicklow Mountain Rescue Team (DWMRT). The team share our commitment to the safety of our communities. Irish Ferries assist the DWMRT with transport services for rescue dogs, volunteers, and equipment to carry out critical search and training operations in Ireland. In October, Irish Ferries staff attended a training event hosted by DWMRT. The event gave the Irish Ferries team great insight into the important work undertaken by DWMRT and the activities supported by our partnership.
ICG is a financial supporter of Sail Training Ireland, who provide young people from all backgrounds with the opportunity to participate in voyages on sailing vessels. The voyages help equip participants with important teamwork and communication skills, as well as promoting self-confidence, self-esteem and providing leadership experience.
We would also like to thank our customers for making their own contributions to important causes. Onboard our Irish Ferries vessels we have collections to support the Royal National Lifeboat Association (RNLI) who are the largest charity saving lives across the seas of the United Kingdom, the Republic of Ireland, the Channel Islands and the Isle of Man. Our customers also contributed to the Irish Heart Foundation by choosing healthy meal options onboard. A percentage of proceeds from healthy meals marked with a heart on our menu is donated to the Irish Heart Foundation.
Over the past year, we have continued to support the Irish Whale and Dolphin Association in their monitoring work. We allow the Irish Whale and Dolphin Association to come on board to conduct viewing exercises to monitor the behaviour and populations of whale and dolphin species around our coastline.
ICG are a proud supporter of the St. Patrick’s festival in Ireland and provide transport for some of the participating bands and acts who travel from the UK for the event. Whilst this year’s festival was cancelled due to Covid-19, we look forward to supporting the festival again over the coming year.
Sunflower Lanyard
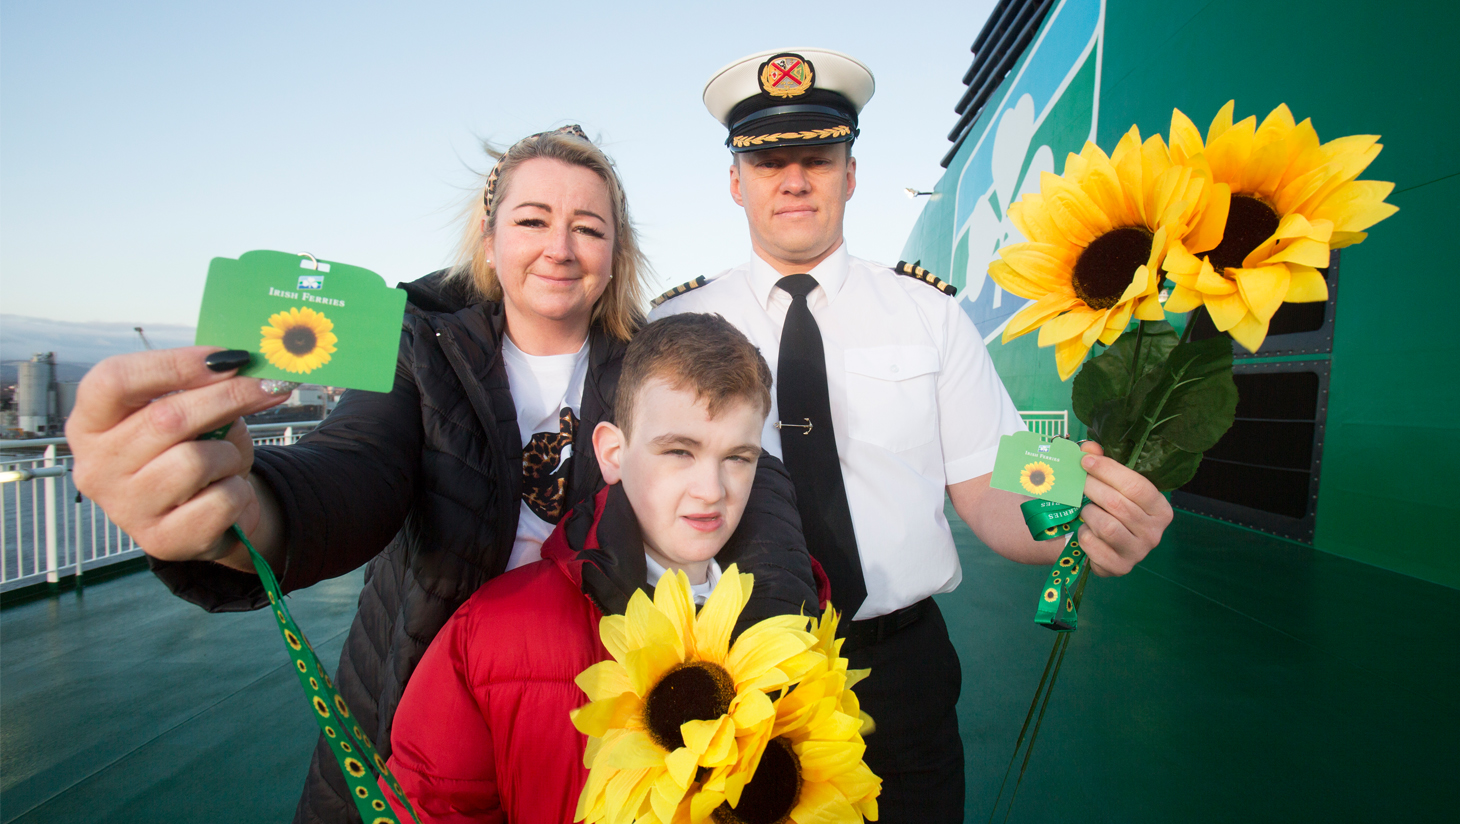
In our 2020 Annual Report we were pleased to announce that in February 2020 Irish Ferries became the first Irish travel operator to introduce the hidden disability Sunflower Lanyard scheme across its entire fleet. Available to all passengers with hidden disabilities, and an addition to the full range of services already available to passengers with restricted mobility, the discreet Sunflower Lanyard enables crew who are specially trained, to readily identify those on-board who may require some extra help, time, or assistance. We continue to look for ways to ensure all customers can enjoy our services.
Supporting Tourism and Local Economies
ICG collaborate with Tourism Ireland, Visit Wales, Cotentin Tourism, Normandy Tourism and relevant port bodies on co-operative campaigns to promote sustainable tourism. The campaigns aim to help reduce seasonality issues and highlight less visited areas and attractions.
This year we participated in Tourism Ireland’s ‘Press the Green Button’ campaign to encourage tourists back to Ireland after the downturn caused by the Covid-19 pandemic. The campaign aims to drive bookings for holidays in Ireland and to position the tourism industry well for 2022.
Where possible we seek to increase the use of local suppliers and showcase local produce in supporting artisan producers. This not only reduces our environmental footprint but positively impacts our local economy. Typical examples include our seafood supplier, a large, family-owned fishmonger based in the fishing town of Howth in North County Dublin who supply locally sourced seafood utilising sustainable fishing methods.
We source all our fruit and vegetables through Irish distributors who guarantee to deliver the freshest produce from farms all around Ireland. When in season, Irish produce will always be selected before imported goods. All our beef is Irish produced and our Irish dairy, cheddar cheese and eggs are Origin Green certified, meaning the farms and producers we source from are independently monitored and verified under Ireland’s pioneering food and drink sustainability program. Our breakfast meats are sourced in counties Kilkenny and Cork.
We are a strong promotor of Irish beverages, not only the larger brands but also smaller producers of craft beers and spirits. In line with the demands of our guests we offer a wide variety of plant-based food and drink options in all our cafés and restaurants. Our coffees are provided by a Dublin-based roaster using the world’s first purpose-built carbon neutral roastery in Dublin. All coffees and teas served on board are fair trade certified. We use local suppliers to service our new Dover-Calais route, including our UK-based coffee supplier that engages in various social projects to support farmers in Guatemala, Tanzania and Peru. We source our on-board wines from a distributor in Cherbourg that provides a vast selection of wines from large and small French wineries. We promote local French wines through special wine tasting events in conjunction with our partner in Cherbourg. Customers have the opportunity to meet with local wine producers and learn more about different wine regions and varietals.
Task Force on Climate-Related Financial Disclosures (TCFD) Report (within ESG report)
Details of how ICG is making progress in implementing the recommendations of the TCFD are set out below. In addition to the four key areas of governance, strategy, risk management and metrics and targets, a complete Appendix cross referencing disclosure against the 11 recommendations is included on page 59 of the Annual Report.
Governance
Disclose the organisation’s governance around climate-related risks and opportunities.
Everything we do at ICG is underpinned by strong governance. Climate-related risks and opportunities are managed and being integrated as a core component of strategy and performance from the highest level of the business. As a leading maritime transport group, in what is an increasingly regulated industry, we recognise how important it is for us to play a leading role in driving more sustainable shipping. Our purpose and strategy are fully aligned to this goal. Oversight of climate-related issues is provided by the Board as a whole, with support from the Audit Committee, in particular in relation to climate risks and opportunities. In terms of management, we have dedicated significant resources to ensuring that climate risks and opportunities are at the forefront of day-to-day activities and operations. We will continue to review the governance of climate-related risks and opportunities in the year ahead to ensure our frameworks evolves with the demands of the outside world.
Strategy
Disclose the actual and potential impacts of climate-related risks and opportunities on the Group’s businesses strategy and financial planning, where such information is material.
Through our purpose, commitments to contribute to the UN SDG and from regulation, ensuring our strategy is aligned with reduced impact on the environment is a core component of our efforts. It is for this reason we have made significant strides in detailing our environmental impact over the past years while also committing to reducing that impact, with data and effective governance at the heart of those steps.
To gain a better understanding of how climate change might impact our business, we reviewed different scenarios occurring over the coming years. These assessments looked at potential physical and transitionary risks of a changing climate such as flooding and water stress, as well as the risks associated with a transition to a low-carbon economy such as international climate policy and the impacts of carbon pricing. As an industry with stringent environmental-related regulations, the implications of regulatory steps have been a core part of our scenario analyses since before the introduction of the TCFD.
The analysis evaluated the implications for ICG’s facilities, fleet and suppliers, as well as the impacts on our consumers. The analysis of both physical and transition risks showed that in both scenarios there is likely to be some financial risks which would need to be managed, but none that would materially impact our business model.
While these analyses were conducted on a qualitative basis and form the foundation of the climate-related risks and opportunities provided below, we aim to conduct a quantitative scenario analysis against a range of warming scenarios in the periods ahead.
Risk management
Disclose how the organisation identifies, assesses and manages climate-related risks.
Climate-related risk management is integrated into our enterprise risk management process, as detailed extensively on pages 62 to 66. The enterprise risk management process is designed to identify, assess, monitor and report on all risk related to the business. Through the TCFD lens, ICG prioritised the climate risk and opportunity assessment, and set out the following risks and opportunities related to climate change:
Consequence (Negative Scenario) | Financial Statement Impact | Opportunity | ||||
Revenue | Expenses | Assets | Liabilities | Capital and Financing | ||
Risk - Increase in extreme weather events | ||||||
Sailing disruption, damage to assets, increased insurance, health and safety hazards, damage to cargoes, supply chain delays, access issues to key locations | Decrease (fewer sailings) | Increase (Insurance costs, repair costs) | Decrease (damage to assets) | Increase (health and safety hazards, damage to cargoes) | Increase in tourism around operating region due to warmer climate. Tourism boost from conscientious travellers looking to holiday locally and using a more efficient mode of travel than by air | |
Risk - Introduction of carbon emission allowances | ||||||
Increased costs to purchase allowances, penalties for non-compliance, increase in fuel costs, difficulty to offset costs over time through ticket surcharges | Partial increase (fuel surcharge mechanism) | Increase (purchase of allowances, increase in fuel costs) | Increase (provisions for emissions allowances and potential penalties) | Amounts paid may contribute to an industry innovation fund that ICG could seek to benefit from | ||
Risk - Negative impact of meeting EEXI/EEDI requirements | ||||||
Increased vessel docking periods to undertake upgrade works, increased capex budgets to meet design requirements, loss of trade due to customer concerns or imposed restrictions, decreased asset values due to poor ratings, reduced charter revenues from inefficient vessels | Decrease (increased vessel docking periods, loss of trade due to customer concerns or imposed restrictions, reduced charter revenues) | Increase (impairment depreciation penalties) | Decrease (poor vessel ratings) | Increased (capex needed to meet design requirements) | Optimise vessel purchasing and selling decisions to consider future compliance and further enhancement costs Reputational improvement by operating fully compliant vessels | |
Risk - Failure of carbon reducing investments and projects to achieve desired efficiencies | ||||||
Substantial capex investment which fails to improve carbon intensity, disproportionate fuel cost reductions, leak, spillage, fire or unintended exposure to alternative fuels harmful to health, energy from alternative sources not enough to meet operational demand | Increase (costs relating to higher than expected carbon intensity, larger quantities of alternative fuels required to meet operational demand) | Increase (potential accidents and hazards from new fuels) | Increased financing to meet capex project requirements | Take a position of market leadership by adopting new technologies to improve environmental performance Opportunity to market new innovative features as unique selling points Reduction in ETS and fuel levy costs | ||
Risk - Poor ESG ratings from external agencies | ||||||
Loss of investor and financier interest as the required ESG grades are not met, loss of revenues and/or customers due to ESG concerns | Decrease (loss of revenues and/or customers) | Increase (financing costs due to limited debt options) | Decrease (loss of financier interest) | Use agency feedback to improve performance and boost future ratings Forge supply chain alliances with customers if strong ESG performance can be demonstrated | ||
Risk - Collective human failure to limit global warming to <1.5 degrees above pre-industrial levels | ||||||
Risk to immobile assets and operations at coastal locations, public health and safety risks, natural resource and supply chain shortages | Decrease (Operational disruption at coastal locations due to flooding) | Increase (higher cost of goods and natural resources due to shortages) | Decrease (risk to immobile assets at coastal locations) | Adopt science-based targets, develop and execute our climate change strategy to play our part in limiting global warming Engage with landlords and local authorities on major incident plans and contingencies in place at ports Enhance procedures to responsibly manage water consumption and other key resources | ||
Risk - Biodiversity loss within operating regions | ||||||
Loss of species and crops, resulting in food shortages and public health and safety risks | Increase (higher cost of goods and natural resources due to shortages) | Help protect biodiversity through ballast water management systems and other sustainable practices Raise awareness in the community about local biodiversity issues Enhance procedures to responsibly manage water consumption and other key resources | ||||
Risk - Unavailable debt financing for capital projects due to operational sustainability concerns | ||||||
Construction of suitable vessels and/or undertaking of certain transport activities not meeting sustainable finance criteria, lack of growth opportunities | Decrease (lack of growth opportunities) | Increase (financing costs due to limited debt options) | Decrease (loss of financier interest) | Identify sustainable projects that will achieve funding to grow the business and ensure long-term viability | ||
Risk - Poor fleet emissions ratings with respect to IMO CII and equivalent EU regulations using MRV | ||||||
Commercial impact of vessels undertaking reduced speed passages to ensure compliance, impairment of vessels with poor ratings, increased capex to meet efficiency requirements | Decrease (commercial impact of vessels undertaking reduced speed passages) | Decrease (Impairment of vessels with poor ratings) | Increased (capex needed to meet efficiency requirements) | Optimise vessel purchasing and selling decisions to consider future compliance and further enhancement costs IMO encouraged rebates and other concessions from ports and authorities for highly rated vessels | ||
Metrics and targets
Over the past number of years, we have commenced collection and disclosure of a range of measures used to assess and manage climate-related risks and opportunities. We have now disclosed our scope 1 and scope 2 emissions and intend to develop our reporting to disclose our scope 3 emissions over time. ICG also adheres to limits on sulphur content of fuel oils, in relation to sulphur oxide (SOx) emissions from the shipping sector, investing approximately €25 million on the installation of exhaust gas cleaning systems (EGCS) in our owned and operated fleet. Studies have shown that EGCS can remove 60 to 90 percent of particulate matter (PM), including a portion of small and ultrafine PM, resulting in fewer particles released in the atmosphere compared to consuming marine gas oil. Separate to our emissions, we provide details of water consumption and waste management throughout our ESG report.
As a business, we have implemented the targets set by the IMO and the EU, including:
- 40 percent reduction in carbon intensity from shipping operations by 2030 compared to 2008 levels
- 50 percent reduction of all GHG from shipping operations by 2050 compared to 2008 levels
- 6 percent reduction in GHG intensity from shipping operations by 2030 compared to 2020 levels
- 75 percent reduction in GHG intensity from shipping operations by 2050 compared to 2020 levels
We have also set the following targets for our terminal operations:
- 70 percent reduction in Scope 1 and 2 emissions by 2025 versus 2020 levels. A 17 percent reduction was achieved in 2021.
- Net zero Scope 1 and 2 operations by 2030.
Over the longer term, we recognise the importance of science-based target setting and look forward to future engagement with the Science Based Targets initiative (SBTi) as we await specific guidance for the transport sector which is currently in development.
Task Force on Climate-Related Financial Disclosures Appendix
Governance | Strategy | Risk Management | Metrics and Targets |
Disclose the organisation’s governance around climate related risks and opportunities. | Disclose the actual and potential impacts of climate-related risks and opportunities on the organisation’s businesses, strategy, and financial planning where such information is material. | Disclose how the organisation identifies, assesses, and manages climate-related risks. | Disclose the metrics and targets used to assess and manage relevant climate-related risks and opportunities where such information is material. |
Recommended Disclosures | |||
(a) Describe the board’s oversight of climate-related risks and opportunities. Refer to pages 55 and 65 | (a) Describe the climate-related risks and opportunities the organisation has identified over the short, medium, and long term. Refer to pages 55 to 57 | (a) Describe the organisation’s processes for identifying and assessing climate-related risks Refer to pages 56 to 57 and pages 64 to 66 | (a) Disclose the metrics used by the organisation to assess climate related risks and opportunities in line with its strategy and risk management process Refer to pages 46 to 47 and page 58 |
(b) Describe management’s role in assessing and managing climate-related risks and opportunities. Refer to page 65 | (b) Describe the impact of climate related risks and opportunities on the organisation’s businesses, strategy, and financial planning. Refer to pages 56 to 57 and page 65 | (b) Describe the organisation’s processes for managing climate-related risks. Refer to pages 64 to 66 | (b) Disclose Scope 1, Scope 2, and, if appropriate, Scope 3 greenhouse gas (GHG) emissions, and the related risks. Refer to page 47 and pages 56 to 57 |
(c) Describe the resilience of the organisation’s strategy, taking into consideration different climate-related scenarios, including a 2°C or lower scenario. Refer to pages 56 to 57 and page 66 | (c) Describe how processes for identifying, assessing, and managing climate-related risks are integrated into the organisation’s overall risk management. Refer to pages 62 to 66 | (c) Describe the targets used by the organisation to manage climate-related risks and opportunities and performance against targets. Refer to page 58 | |
Disclosures by Non-Financial Undertakings under Article 8 of the EU Taxonomy Regulation
The Group is required to apply the requirements of the EU Taxonomy Regulation. The EU Taxonomy, first published in 2020, is a classification system intended to establish a list of environmentally sustainable economic activities and sectors that play a key role in climate change mitigation and adaptation to support sustainable financing. Under the Taxonomy, for an economic activity to be considered environmentally sustainable, certain criteria must be met across six environmental objectives:
- Climate change mitigation
- Climate change adaptation
- The sustainable use and protection of water and marine resources
- The transition to a circular economy
- Pollution prevention and control
- The protection and restoration of biodiversity and ecosystems.
Ahead of reporting on the alignment of ICG activities with the Taxonomy next year, the Group is currently required to disclose the proportion of its turnover, CapEx and OpEX eligible for assessment under the Taxonomy.
Based on a comprehensive analysis of the Group’s economic activities against the range of activities listed in the EU Climate Delegated Act and NACE classification system, the Group determines it has Taxonomy-eligible undertakings in accordance with activity 6.10 ‘Sea and coastal freight water transport, vessels for port operations and auxiliary activities’ (Annex I: climate change mitigation/ Annex II: climate change adaptation).
All integrated services necessary to and dependent on the operation of vessels for the combined transport of freight and passengers on sea or coastal waters are also considered eligible and are therefore included within the reported metrics below. This includes service activities incidental to water transportation such as; on board passenger services, Group stevedoring services and quay-to-door container transport services that are component activities embedded within our sea transport offerings to customers.
The Group’s Consolidated Financial Statements have been prepared for the financial year ending 31 December 2021 in accordance with IFRS. The amounts used for the calculation of the turnover, CapEx and OpEx ratios are accordingly based on the reported data in those Consolidated Financial Statements.
KPIs
Turnover KPI
The turnover KPI is calculated by the proportion of the net turnover derived from services that are Taxonomy-eligible.
Turnover KPI = 100% | Taxonomy-eligible net turnover |
Net turnover |
The total turnover of €334.5 million for the financial year ending 31 December 2021 is the basis for the denominator for the turnover KPI as presented in the Consolidated Income Statement on page 132.
The total turnover of €334.5 million reported in the Consolidated Income Statement was examined across all Group companies to determine whether it was generated from Taxonomy-eligible activities as set out in Annex I (Substantial contribution to climate change mitigation) and Annex II (Substantial contribution to climate change adaptation) of the Climate Delegated Act. A detailed analysis of the items included in the sales turnover is used to allocate the respective sales turnover to the Taxonomy-eligible economic activities. The sum of the sales turnover of the Taxonomy-eligible economic activities for the financial year ending 31 December 2021 represents the numerator. The Group has determined its revenue generating activities to be fully eligible.
CapEx KPI
The CapEx KPI is calculated as the proportion of the capital expenditure of an activity that is Taxonomy-eligible.
CapEx KPI = 100% | Taxonomy-eligible |
Additions to tangible and intangible assets |
The capital expenditures amount to €55.2 million, comprising strategic and maintenance capital expenditures. The sum of the additions that reflect investments in Taxonomy-eligible activities forms the numerator.
OpEx KPI
The OpEx KPI is calculated as the proportion of the operating expenditure associated with Taxonomy-eligible activities.
OpEx KPI = 100% | Taxonomy-eligible operating expenses |
Total OpEx as defined in the EU-Taxonomy |
The amounts reflecting direct non-capitalised costs relating to short-term leasing, maintenance and repair expenses and any other direct expenditures relating to the day-to-day servicing of Group assets or third parties to whom the activities are outsourced that are necessary to ensure the continued and effective functioning of such assets were considered for the denominator calculation.
The numerator is derived from an analysis of the operating expenses associated with Taxonomy-eligible activities.